“You can’t improve what you don’t measure,” said writer and consultant Peter Drucker, and property management is no exception. Tracking your property management KPIs is the only way to truly know if your business is a success, or heading for trouble.
But it’s easy to fall into the trap of thinking you need to track absolutely everything – which is a one-way ticket to burnout and overwhelm, and cause you to lose sight of what’s truly important.
Yes, it’s crucial to track property management KPIs, but it’s just as important to pick the ones that make sense for you and master a few key measures first.
That’s why in this article we explain:
- Why it’s crucial to track property management KPIs.
- The 8 most effective property management KPIs to track.
- Our top recommended tools to track property management KPIs more effectively, with less work!
Rentals United is not just a channel manager, but a partner to help you achieve your business goals. See how we can help you improve your business with a combination of market data, booking performance metrics and a diverse mix of sales channels.
Book a demo now
.
Why is it crucial to track property management KPIs?
As you may already know, KPI stands for Key Performance Indicator. As the name suggests, these data points enable you to measure the success of your business (how it is performing).
For example, KPIs help you to:
- Ensure profitability.
- Stay focused on your business goals.
- Identify flaws in your strategy.
- Tweak what’s not working.
- Make insightful decisions based on real data.
The 8 most effective property management KPIs to track
To avoid overwhelm and to stay super-focused on the goals that really matter, we recommend tracking some of the following. Want to track them all? Start with a few choice KPIs, and then work up as you master each.
1. RevPAR
RevPAR stands for Revenue Per Available Rental and is a core metric used by everyone from vacation rental property managers to global hotel bosses. To calculate it, multiply your Average Daily Rate (ADR, see below) by the Occupancy Rate (OR, also see below); or divide your total revenue by the number of occupied nights.
RevPAR gives a comprehensive view of how your business is doing, as it combines other key metrics too. Your RevPAR will change depending on whether you’re focusing most on selling each night at the highest rates possible or maximising occupancy (read more below).
2. ADR
ADR stands for Average Daily Rate and it shows the average amount each guest paid for a night over a chosen period. To calculate it, divide the total revenue by the number of nights sold.
A high ADR may mean you make maximum money during high season or in-demand periods, but it could cause your occupancy to drop outside of these times.
3. Occupancy Rate
Occupancy Rate (OR) is a percentage. To calculate it, divide the number of nights sold by the total number of nights in a given period. This will show you how often you had guests in your rentals versus your total availability.
A higher occupancy rate shows that your calendar was more likely to be booked over a given time period. However, to push this up, you may need to reduce your nightly rate, depending on factors such as location or time of year. A lower ADR usually translates to higher Occupancy and vice versa.
4. CAC
It’s a common saying in the business world that it costs more to get a new customer than it does to encourage repeat customers. That’s because of CAC or Customer Acquisition Cost.
Your CAC is the cost it takes your business to acquire a new customer. It can depend on factors such as how much you’re spending on social media (including the value of your time, or paying someone to manage your socials), online advertising campaigns and other costs such as your channel manager or listing distribution connection to your PMS.
Of course, getting new customers can be the lifeblood of your business, but it’s important to ensure your CAC isn’t too high or it will cut into revenue and ROI (see below). Set a goal to reduce it as much as possible while still making your other KPIs.
5. ROI
ROI is one of the most well-known business KPIs, which stands for Return On Investment. To calculate it, take your revenue, and subtract your costs (or investments), including operational spending, and marketing costs (including CAC).
Ultimately, you want to increase your ROI, by lowering your costs and increasing the amount of money you’re actually making.
6. Owner fee structures
As it sounds, your owner fee structure refers to the pricing structure you’re using in your business from the homeowners’ point of view.
It’s best to figure out which structure makes the most sense for you and to re-evaluate or change it if you feel it’s not serving you as well as it could.
For example, you might choose between:
- Guaranteed income: The owner is guaranteed a fixed amount each month.
- Fixed rate: A charge per month for handling bookings and costs such as cleaning fees.
- Commissions: You take a commission on each booking, in return for your management. This can be 25-50%. The average is around 27%.
7. Direct bookings
Tracking direct bookings is an important metric when it comes to repeat business and may help your CAC.
Focusing on direct bookings means you are less reliant on OTAs and therefore don’t need to pay their fees. Of course, being present on a variety of OTAs is still essential for your business, but supplementing your channel distribution with direct bookings is becoming more and more important.
Taking direct bookings will mean extra costs such as setting up your own website, and hosting a booking or payment platform on the site – but it pays off in the long run.
Having somewhere to send people to make direct bookings may also help your ROI in terms of advertising spend, for example, as people can come straight to you from your post or advert, without any middle fees.
Tracking your direct bookings can help you tweak your strategy to keep happy guests coming back (repeat business) and encourage new guests to book directly with you (direct bookings).
To do this, consider how many direct bookings you receive compared to the number of bookings from OTAs as a percentage, and set a goal to increase the direct percentage.
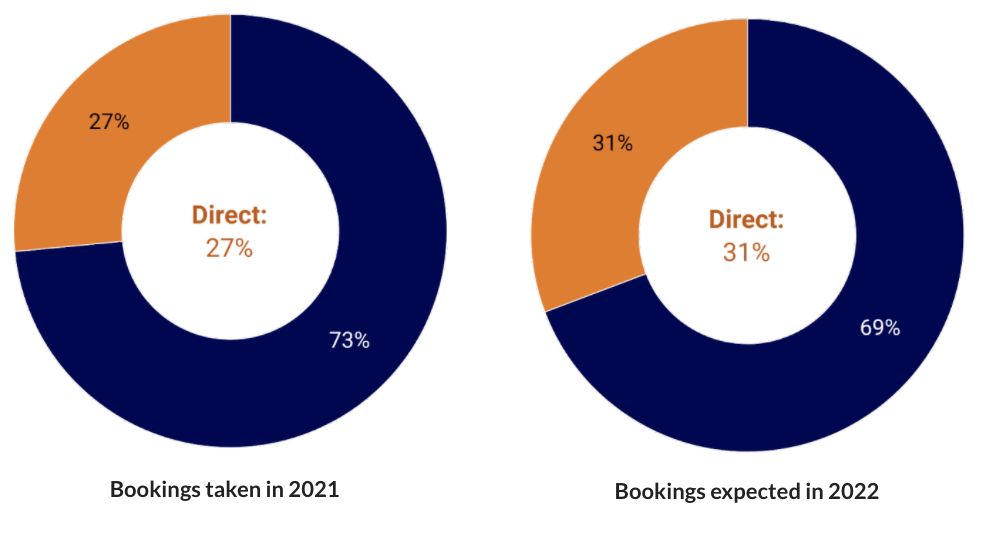
The Global Vacation Rental Report 2022 by Rentals United and Transparent shows that in 2022, direct bookings worldwide are expected to grow to 31% (vs 69% from OTAs) compared to 27% (vs 73% OTAs) in 2021.
This is especially true in Latin America, where direct bookings are expected to increase from just 16% in 2021 to 25% in 2022; and in North America (26% in 2021 to 30% in 2022).
In Oceania, direct bookings are already almost literally half the story – in 2021 and 2022 the figures show them accounting for 47% of bookings (53% OTAs).

8. Listing optimisation
It may seem less “numeric” than some of the other KPIs, but this metric is still crucial to track, as your listings are your shop windows to your potential booking guests.
Listing optimisation means making your listings as effective and attractive as possible, to drive the maximum number of bookings, and improve your other metrics (such as ROI, occupancy, and even ADR).
Regularly ask yourself questions such as:
- What are you doing to make your properties look the best they can to drive bookings?
- Does your listing answer guests’ most common questions to help them book confidently?
- Do your listings highlight the uniqueness of your properties and help guests see themselves staying there?
- Do your listings clearly explain amenities, facilities, check-in and check-out processes, and any other key practical details?
- How often do you update your listings to keep them fresh and relevant?
- Are your house rules and policies clearly and politely stated?
- How are you comparing with your competitors?
- Do you have great photos? Do they show anything and everything a guest might want to see, including the view, amenities, and close-ups?
- When did you last update your photos?
- Do your listings look great and function perfectly on both desktop and mobile devices?
- If you were to see your listings – would you want to book them?
Tools such as Rentals United Data Studio can indicate improvement opportunities for your listings. Its ingenious Property Health Cards can identify any missing information quickly, and automatically point out key details that make your listings more likely to convert.

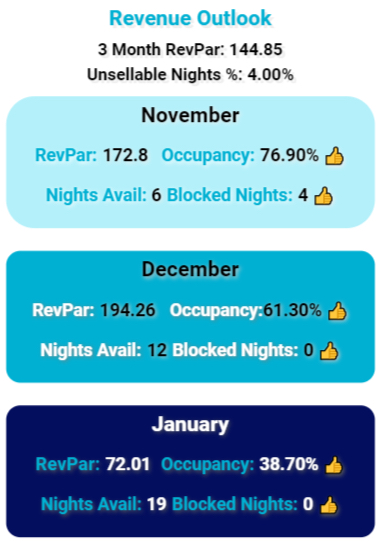
Your Property
Health Cards compile data from across your sales channels to show the health of your listings, taking into account factors such as your amenities, photos, date since the last booking and revenue outlook, which is based on your occupancy and available nights.
The Unsellable Nights metric enables you to check your property’s availability health at a glance, and see how many of your nights are blocked over the next 30, 60, and 90 days. A score of less than 5% is best. Anything over 5-16% means you should consider unblocking some dates to increase revenue. A score of more than 16% means your revenue potential may be seriously affected if you don’t unblock more nights quickly.
These metrics enable you to track the health of your listings using numeric data, as well as the more subjective questions above.
Tools to help you track property management KPIs
Managing property management KPIs manually can be time-consuming, painstaking, and unrealistic. Luckily, there are tools out there that can automate the process, save time, and provide more reliable, actionable data.
Rentals United Data Studio
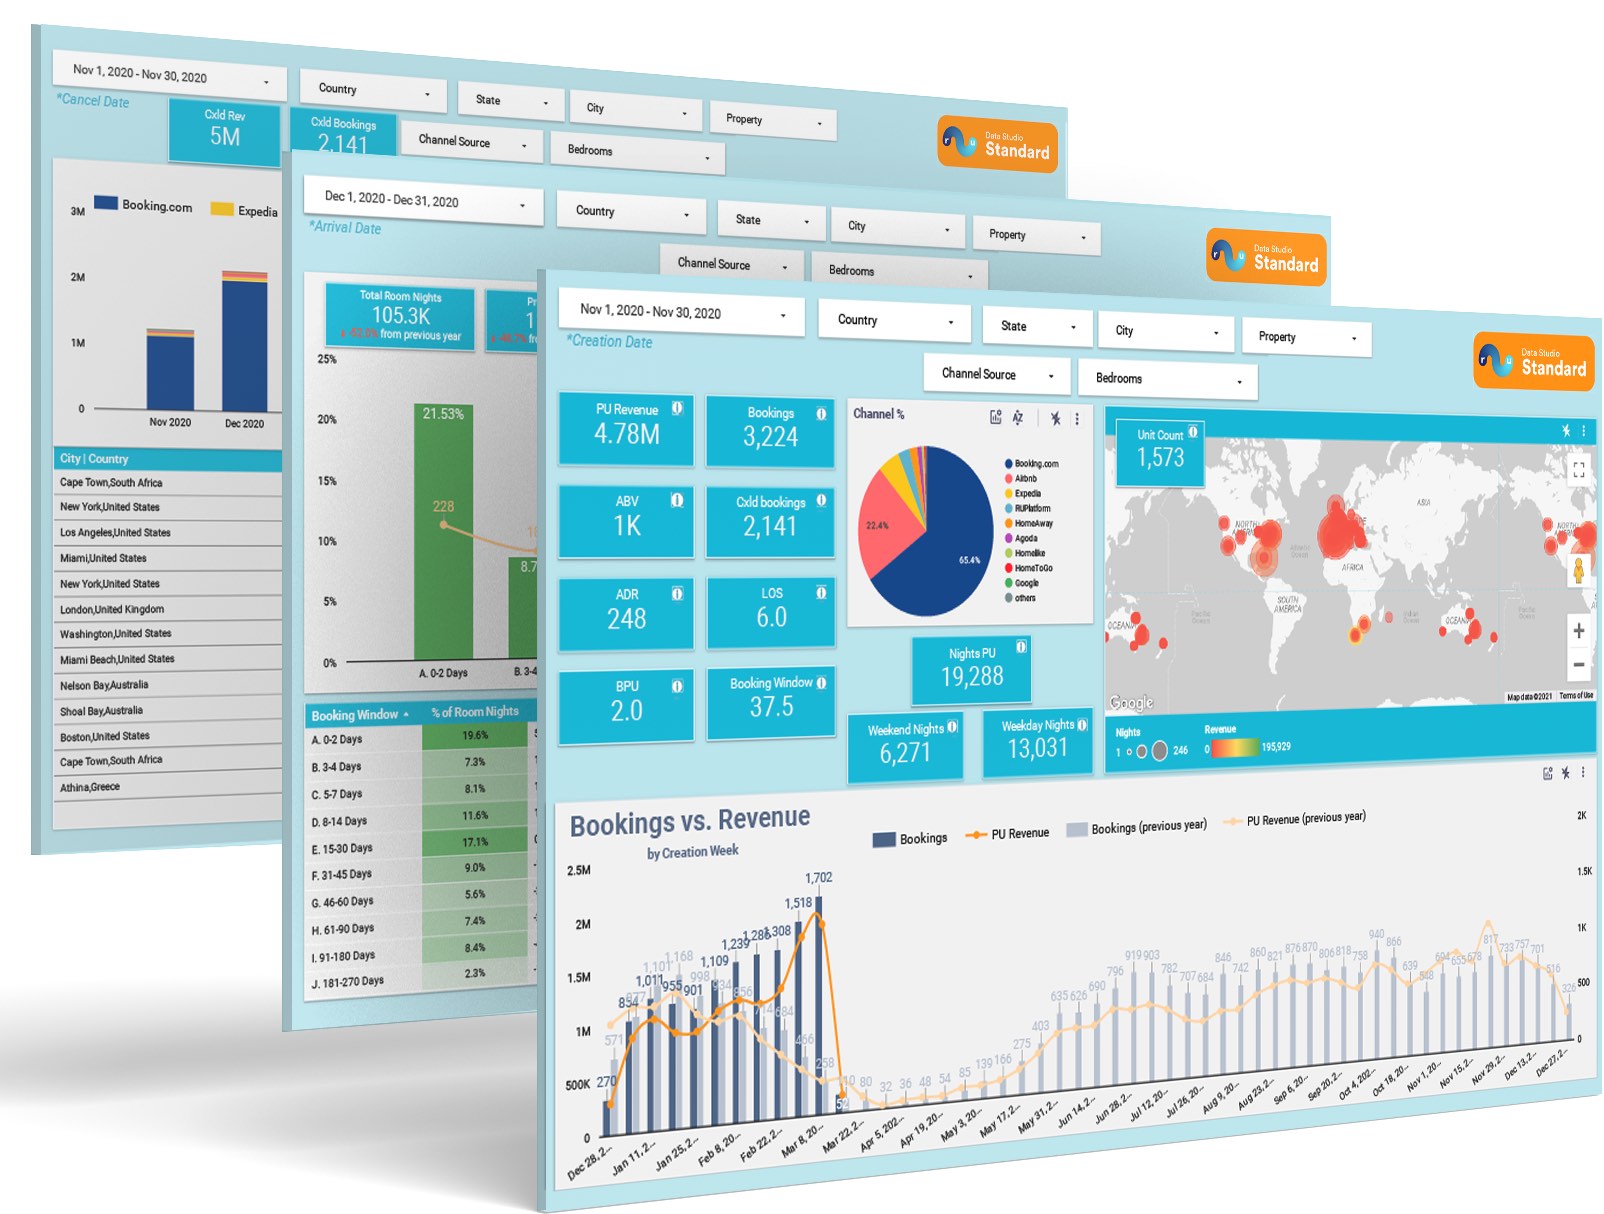
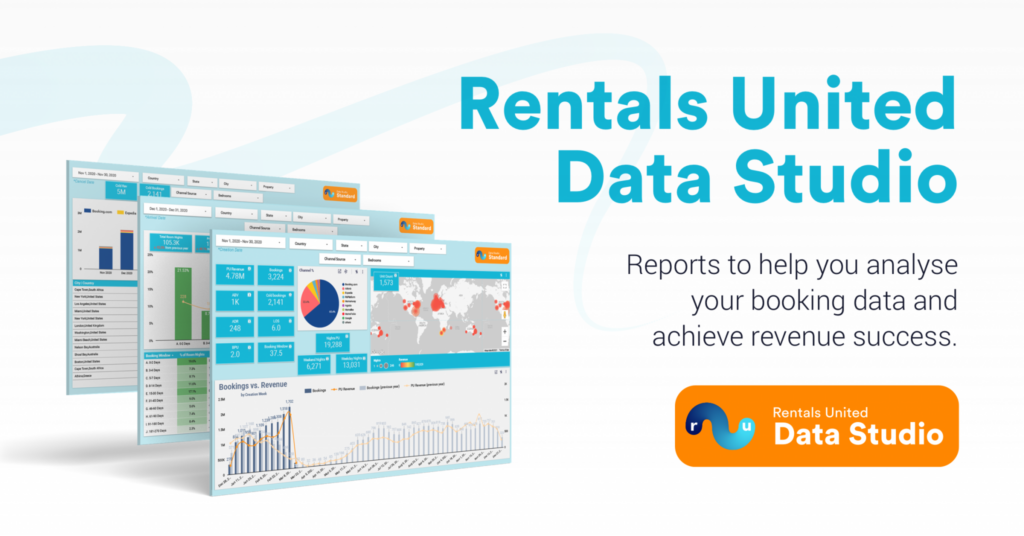
Rentals United Data Studio is a comprehensive, self-service software tool that helps property managers stay on top of a wide range of property performance metrics.
As an add-on to the Rentals United channel manager, RU Data Studio’s basic features are free to access for all Rentals United customers. Additionally, RU Data Studio has a premium tier available to purchase separately for even more powerful insights.
The tool features a dashboard of easy-to-view metrics that you can track daily, including the number of nights sold, your RevPAR, ADR, occupancy, blocked nights and the top-performing vacation rental distribution channels.
It also offers critical details such as which amenities (such as high-speed WiFi, TV, pool, or a hot tub) convert the best, which days of the week guests are most likely to leave reviews, which of your properties are performing best and how your listing photos first appear to potential new guests.
Rentals United also integrates with a vast array of common PMSs, including Guesty, Hostfully, Escapia, and Mews.
Once it’s set up – with help from our leading customer service and support team – RU Data Studio can help you master your online distribution, increase your bookings, and save hours of time in the process.
Wheelhouse
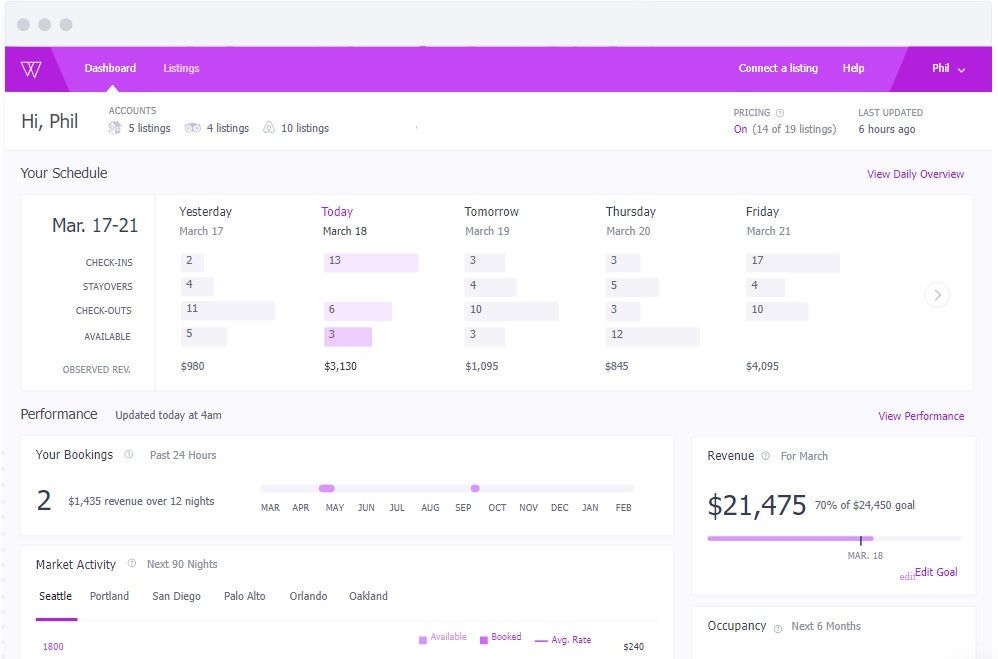
Wheelhouse is a comprehensive platform designed to help you take charge of your revenue in all conditions, with dashboards for metrics such as minimum rates, seasonal adjustment suggestions and weekend rate guides.
It uses automatically-gathered data over time to offer actionable insights that it claims can help push revenue by up to “40% in minutes”.
Wheelhouse integrates with a variety of PMSs and channel managers including Rentals United.
Pricelabs
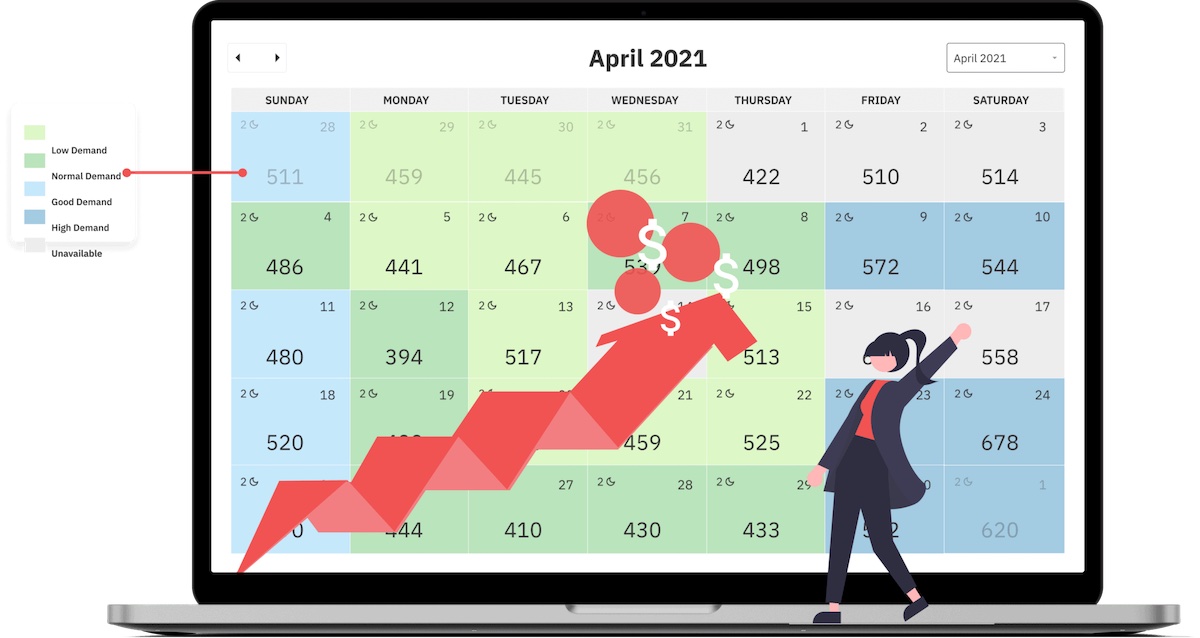
PriceLabs is a dynamic pricing tool that has been designed to work especially well with OTAs such Airbnb and Vrbo, property managers with direct booking platforms, and PMSs such as Hostify, My VR and Lodgify. It also integrates with Rentals United.
The tool identifies trends across your monthly calendar and also highlights need-to-knows such as local events that could impact demand and nightly rates.
Beyond

Beyond specialises in offering a range of insights for your property portfolio, including automated pricing, guidance on revenue management, OTA syncing and deep performance data.
Its dynamic pricing algorithm that helps you compare rates year-on-year, and claims to “takes the guesswork” out of revenue.
Beyond also integrates with lots of vacation rental software providers including Rentals United.
Property management KPIs: The bottom line
Learn the Secret Sauce for Successful Property Managers.
Ultimately, the best property management KPIs to track are the ones that make the most sense to your business. It’s better to master some core KPIs, and tweak them one by one, so you can perfect each and figure out what’s working (and what’s not), before moving on to other, more complex metrics.
Staying focused on core KPIs such as RevPAR, ADR, Occupancy, CAC and ROI is a solid place to start when looking at your business data.
Tracking KPIs helps to provide invaluable insights so you can act with confidence on key questions such as how to structure your business, which distribution channels are working, which amenities are a must-have and how to secure those all-important direct bookings.
See daily operations in A Day in the Life of a Property Manager.
Here’s to a data-driven, successful business – because “wishing and hoping” is not a sustainable strategy!

Frequently asked questions about property management KPIs
How do you measure property management performance?
You measure property management performance by choosing a set of core metrics that help you gather measurable insights into how your business is performing. These are known as KPIs or Key Performance Indicators and they can include everything from revenue per available room (RevPAR), to occupancy, to how much it costs to get each new booking (CAC).
How do you choose the right property management KPIs?
You choose the right property management KPIs by picking a few core data metrics that make the most sense to your business. Focusing on those few – at least at first – helps to avoid overwhelm and stops you from losing sight of the most important data. Revenue per available room (RevPAR), Average Daily Rate (ADR) and Customer Acquisition Cost (CAC) are some of the most commonly-tracked metrics.
What tools help you track property management KPIs?
Tools to track property management KPIs include digital platforms that pull data from your listings to offer automated, daily-updated insights at a glance. Rentals United Data Studio is one such tool, which focuses on metrics such as RevPAR, ADR, occupancy, channel and amenities performance. Revenue management tools are also useful to help you price properties more competitively depending on the season, competition and more. These include Wheelhouse, PriceLabs and Beyond.
Rentals United is not just a channel manager, but a partner to help you achieve your business goals. See how we can help you improve your business with a combination of market data, booking performance metrics and a diverse mix of sales channels.
Book a demo now
.
