Airlines and hotels have been using pickup to inform their revenue management decisions for decades – but this immensely useful KPI is only just starting to gain traction in vacation rental revenue management.
Until recently, vacation rental revenue managers had inelegant solutions – like complicated Excel sheets – for creating pickup reports, and much of the work was done intuitively. However, we now have powerful tools that allow us to visualise our daily pickup and take decisions effectively.
As a vacation rental revenue manager, starting your day by looking at your pickup report can be tremendously helpful in giving you a roadmap for the day and spotting dates in your calendar where you need to take action. But what is pickup, and how do you use it?
To find out, we asked John deRoulet, Director of Enterprise Sales at dynamic pricing and revenue management platform Wheelhouse to share his insight on all things pickup. Let’s get started!

What is pickup?
Pickup indicates how many room nights or how much revenue you’ve sold in a certain period for a given date in the future.
It shows you how your bookings are pacing with stayed-on dates instead of booked-on dates.
“A lot of people when they look at pacing, they look at sales data,” says John. “For example, they’ll say: ‘Today, I sold $10,000 in future room nights.’”
Pickup is reorienting that approach.
“You look at all the days that people could stay in the future and you count up how many rooms or how much revenue each of those days has, and how recently you’ve sold them,” John says.
To understand the difference between booked-on sales and stayed-on revenue, let’s take a look at the bar graphs below.
Booked-on sales vs stayed-on revenue
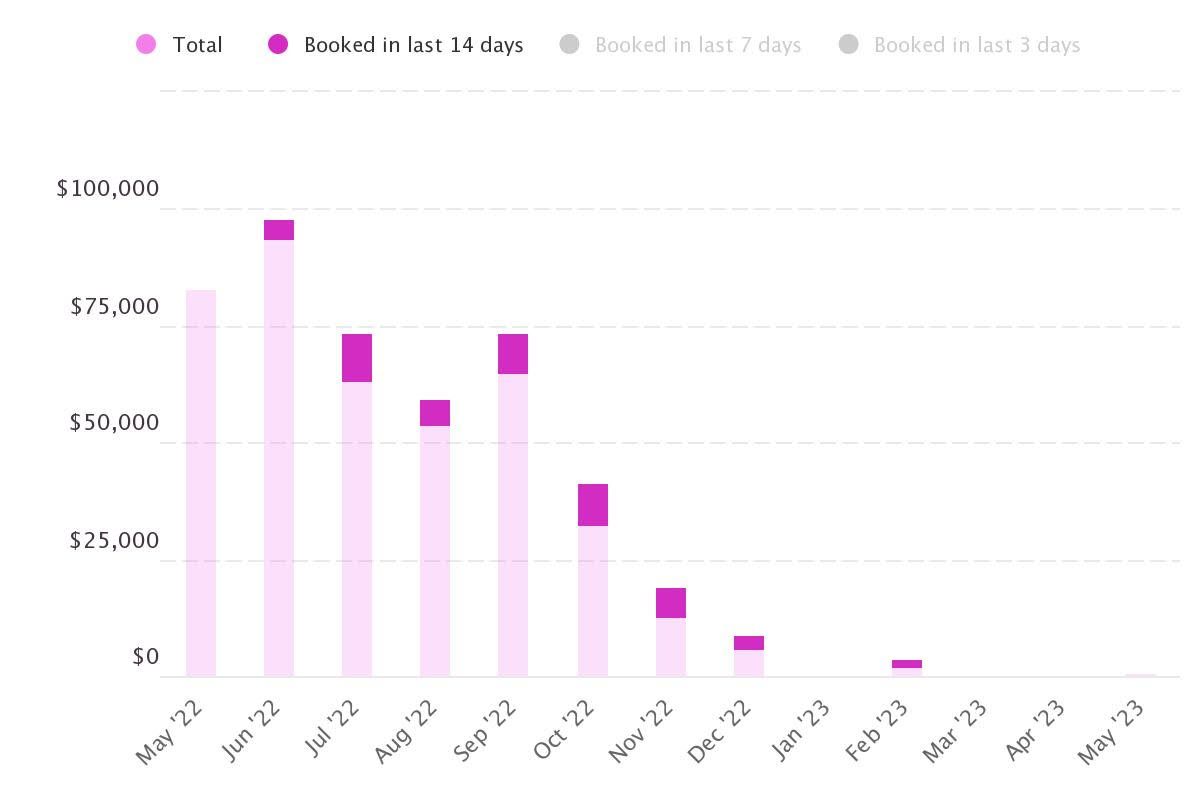
In this graph, each bar shows how much revenue has been sold for the periods on the X-axis.
So, in this particular portfolio, there is nearly $75,000 booked for September.
“This money is actualising in September,” John says. “So you could say: ‘I expect to make $75,000 in September’. Or, if you were looking at it in hindsight, you could say ‘I made $75,000 in September.’”
Knowing the difference between booked-on sales and stayed-on revenue is crucial to maximising your revenue.
While your booked-on sales may be pacing similarly to last year’s, your stayed-on revenue could be pacing behind – which means you need to make revenue management decisions urgently.
| Week 1 | Week 2 | Week 3 | Total | |
| Booked on (last year) |
$10,247 | $8,029 | $9,250 | $27,526 |
| Booked on (this year) |
$10,530 | $7,730 | $8,950 | $27,210 |
| Booked for next 30 DBA (last year) |
$2,536 | $2,210 | $1,465 | $6,211 |
| Booked for next 30 DBA (this year) |
$1,027 | $1,839 | $1,795 | $4,661 |
Revenue vs booked nights
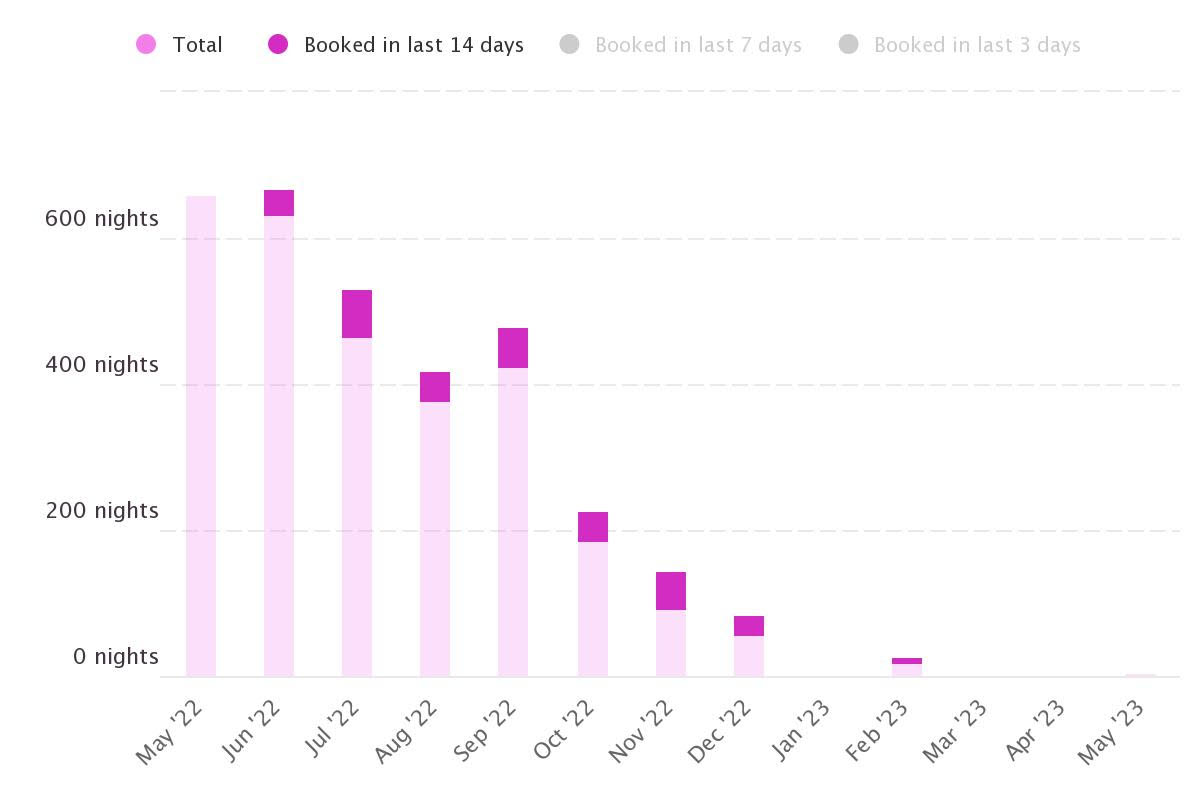
Instead of total revenue, some revenue managers like John prefer to look at booked nights.
Booked nights – a surrogate for occupancy – may be a better metric to use than revenue when you’re grouping together properties that are similar but not the same (we’ll talk about how to group your properties later.)
The concept of pickup is when you start applying booking velocity (i.e. booking pace) to your total revenue or booked nights.
“You try to understand, in a certain time period, how much revenue or how many nights you have sold for all your future time periods,” says John.
For example, you can ask yourself: “How much did I pick up in the last 14 days?”
Sticking to the example above, this portfolio has 448 nights on the books for September. In the last 14 days, they sold 34 of those 448 nights.
But how does all this help you make better revenue management decisions? Let’s take a look.
How can you use pickup to take actionable revenue management decisions?
To be able to use this data to make pricing decisions, you need to look at specific dates in the future.
“When you bring it down to a daily level, you can start to get an idea of where all your money is and where you’re not making sales – which is the most important thing for a revenue manager,” says John.

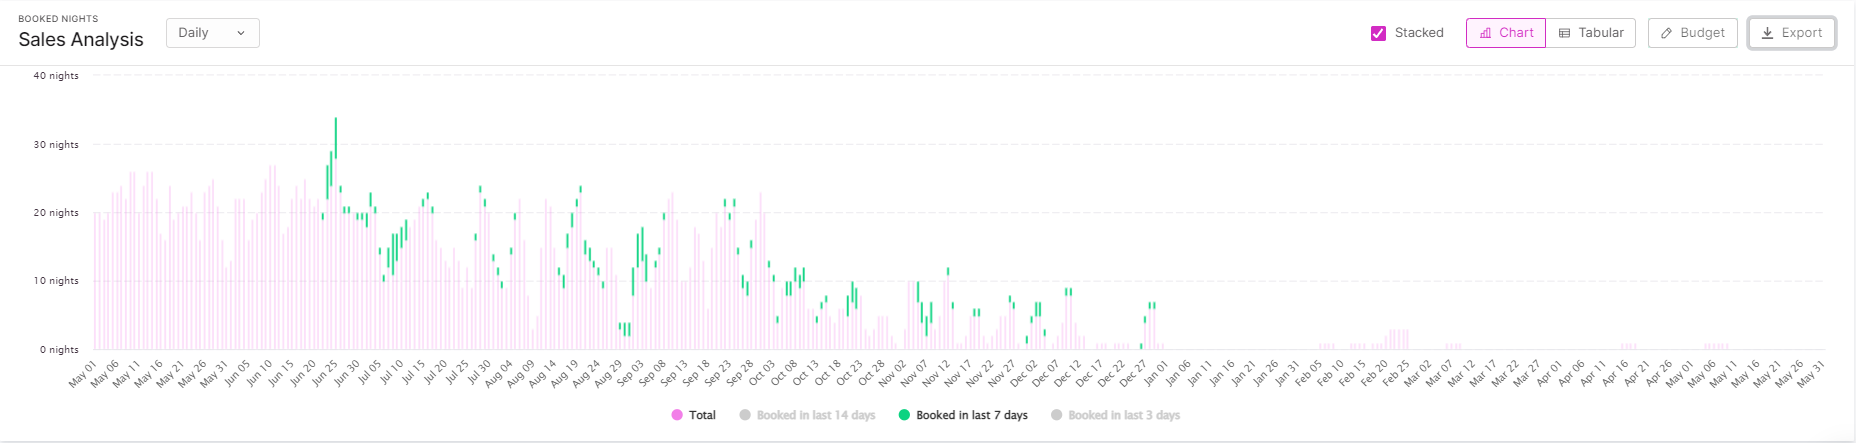
By looking at your booked nights, you can instantly tell where the occupancy gaps are.
And when you consider the time periods on the X-axis, you can see at a glance how your sales were pacing in the last 14, 7 or 3 days. The combination of this data allows you to make informed revenue management decisions.
“For example, if you see a date range in the future that’s getting booked unusually early, you might be able to raise your rates for those dates. Because those dates are not only starting to get more occupancy earlier than you’d expect, but it’s also happening recently,” John says.
“Then, you can look at how those dates are selling week-over-week. If they continue to sell, you can continue to push your rates up. If they don’t continue to sell, you can make a decision: should you lower your rates back down or leave them up and see if they do sell eventually?” he adds.
Once you know this, you can set a reminder for yourself to check back on those dates later and if they don’t sell, pull the rates back down.
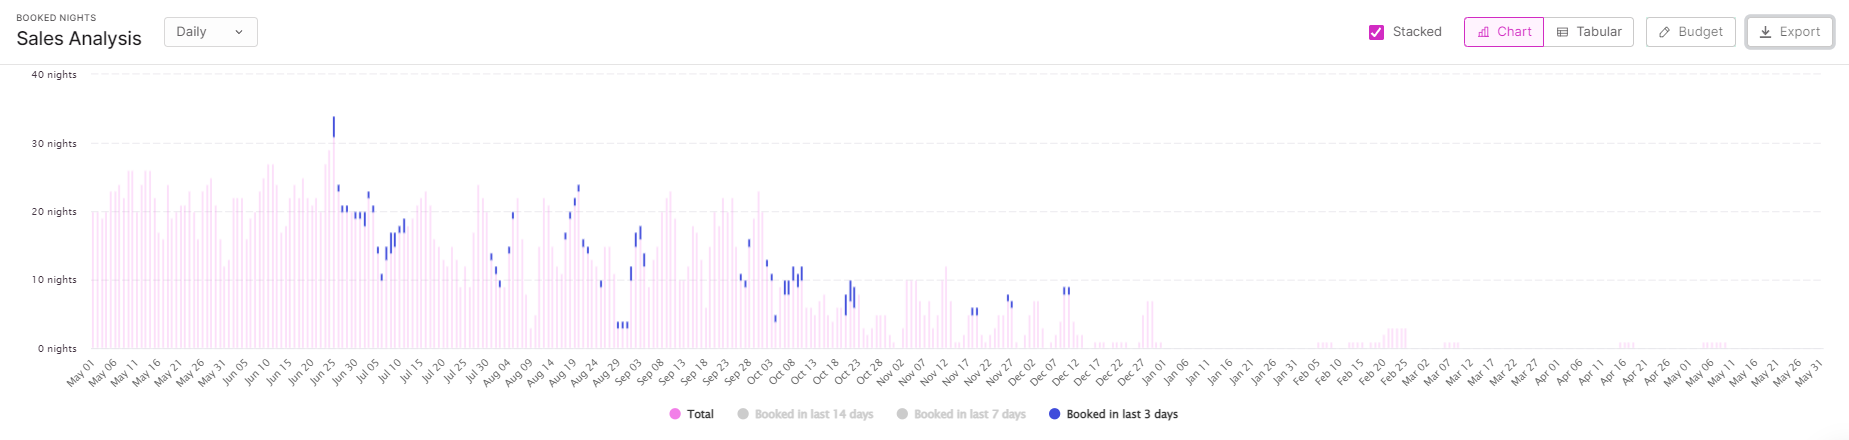
Here’s another example using a different portfolio:
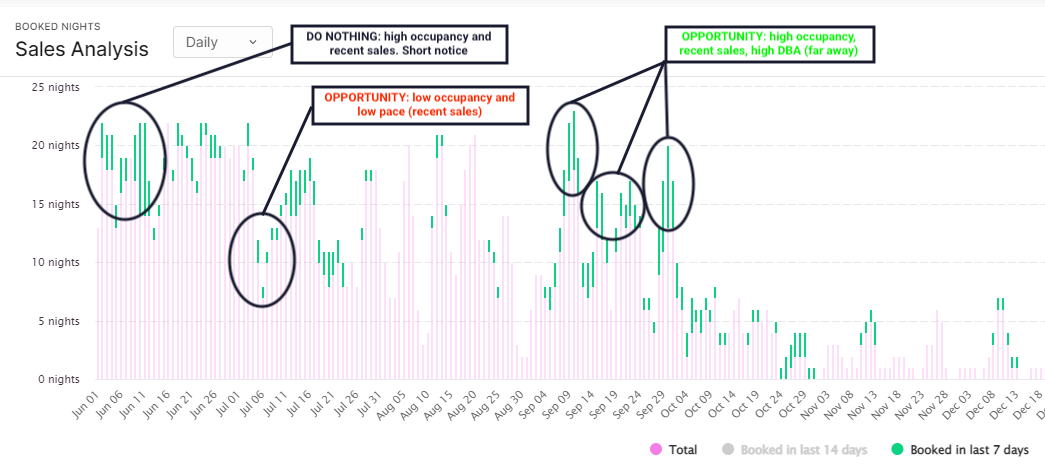
As you can see, near-future dates with low occupancy and low pace (where you’ve made limited recent sales) may present an opportunity to lower your rates and capture demand.
On the other hand, more far-out dates that are pacing higher (shown by the larger green portions of the bar) than you’d expect may present an opportunity to raise your rates and capture a higher ADR.
At the end of the day, you will have to set your own guidelines for what pace is high or low, and where you are comfortable seeing your occupancy at any given time – but that is a conversation for another article!
Portfolio organisation: How to group your properties together
“One of the most important things about being able to use pickup-based revenue management practices is that you have to learn how to group your properties together based on similarities,” says John.
“It’s very difficult to revenue manage any volume of units individually. If you look at individual units, you can only extrapolate demand horizontally (on the tape chart): however, that doesn’t always work because the fact that a unit was booked last week doesn’t necessarily mean that it’s going to be booked next week.”
“On the other hand, when you look at a group of properties, you can start to extrapolate demand vertically (on the tape chart). So if you see that your 4-bedrooms are booking much earlier than you expected them to, that might indicate your 2 and 3 bedrooms will start booking earlier than they usually do, too,” he says.
Here are some best practices to follow when grouping your properties together:
- Use the most discreet group possible while still having enough data to draw conclusions.
- Group your properties by market. Then, if you spot a trend on the market level, you can dig deeper and look at smaller groups (for example, 2-bedrooms and 3-bedrooms vs 1-bedrooms) before you make a decision to increase or decrease your rates. This is important because you might find that while your 2 and 3-bedrooms are pacing higher than you’d expect, your 1-bedrooms aren’t – so you may not want to raise your rates for those smaller units.
- If you’re unsure, make your final decision at the individual unit level considering what you know about that specific unit.
How to use pickup to improve your channel distribution
At Rentals United, we believe that using distribution data to inform your revenue management decisions is the best way to maximise your performance and outrun the competition.
That’s why we’ve created Rentals United Data Studio, a tool that allows you to layer distribution data on top of your revenue management KPIs.
To see what we mean, check out the screenshots below. RU Data Studio allows you to create a pickup report that incorporates data on channel performance.
It shows you your booked-on sales (how much revenue you picked up in the selected date range, along with a variety of other metrics) and how your listings performed on each of your sales channels.
This is advantageous because it allows you to optimise your channel mix and increase your revenue on each of your sales channels.
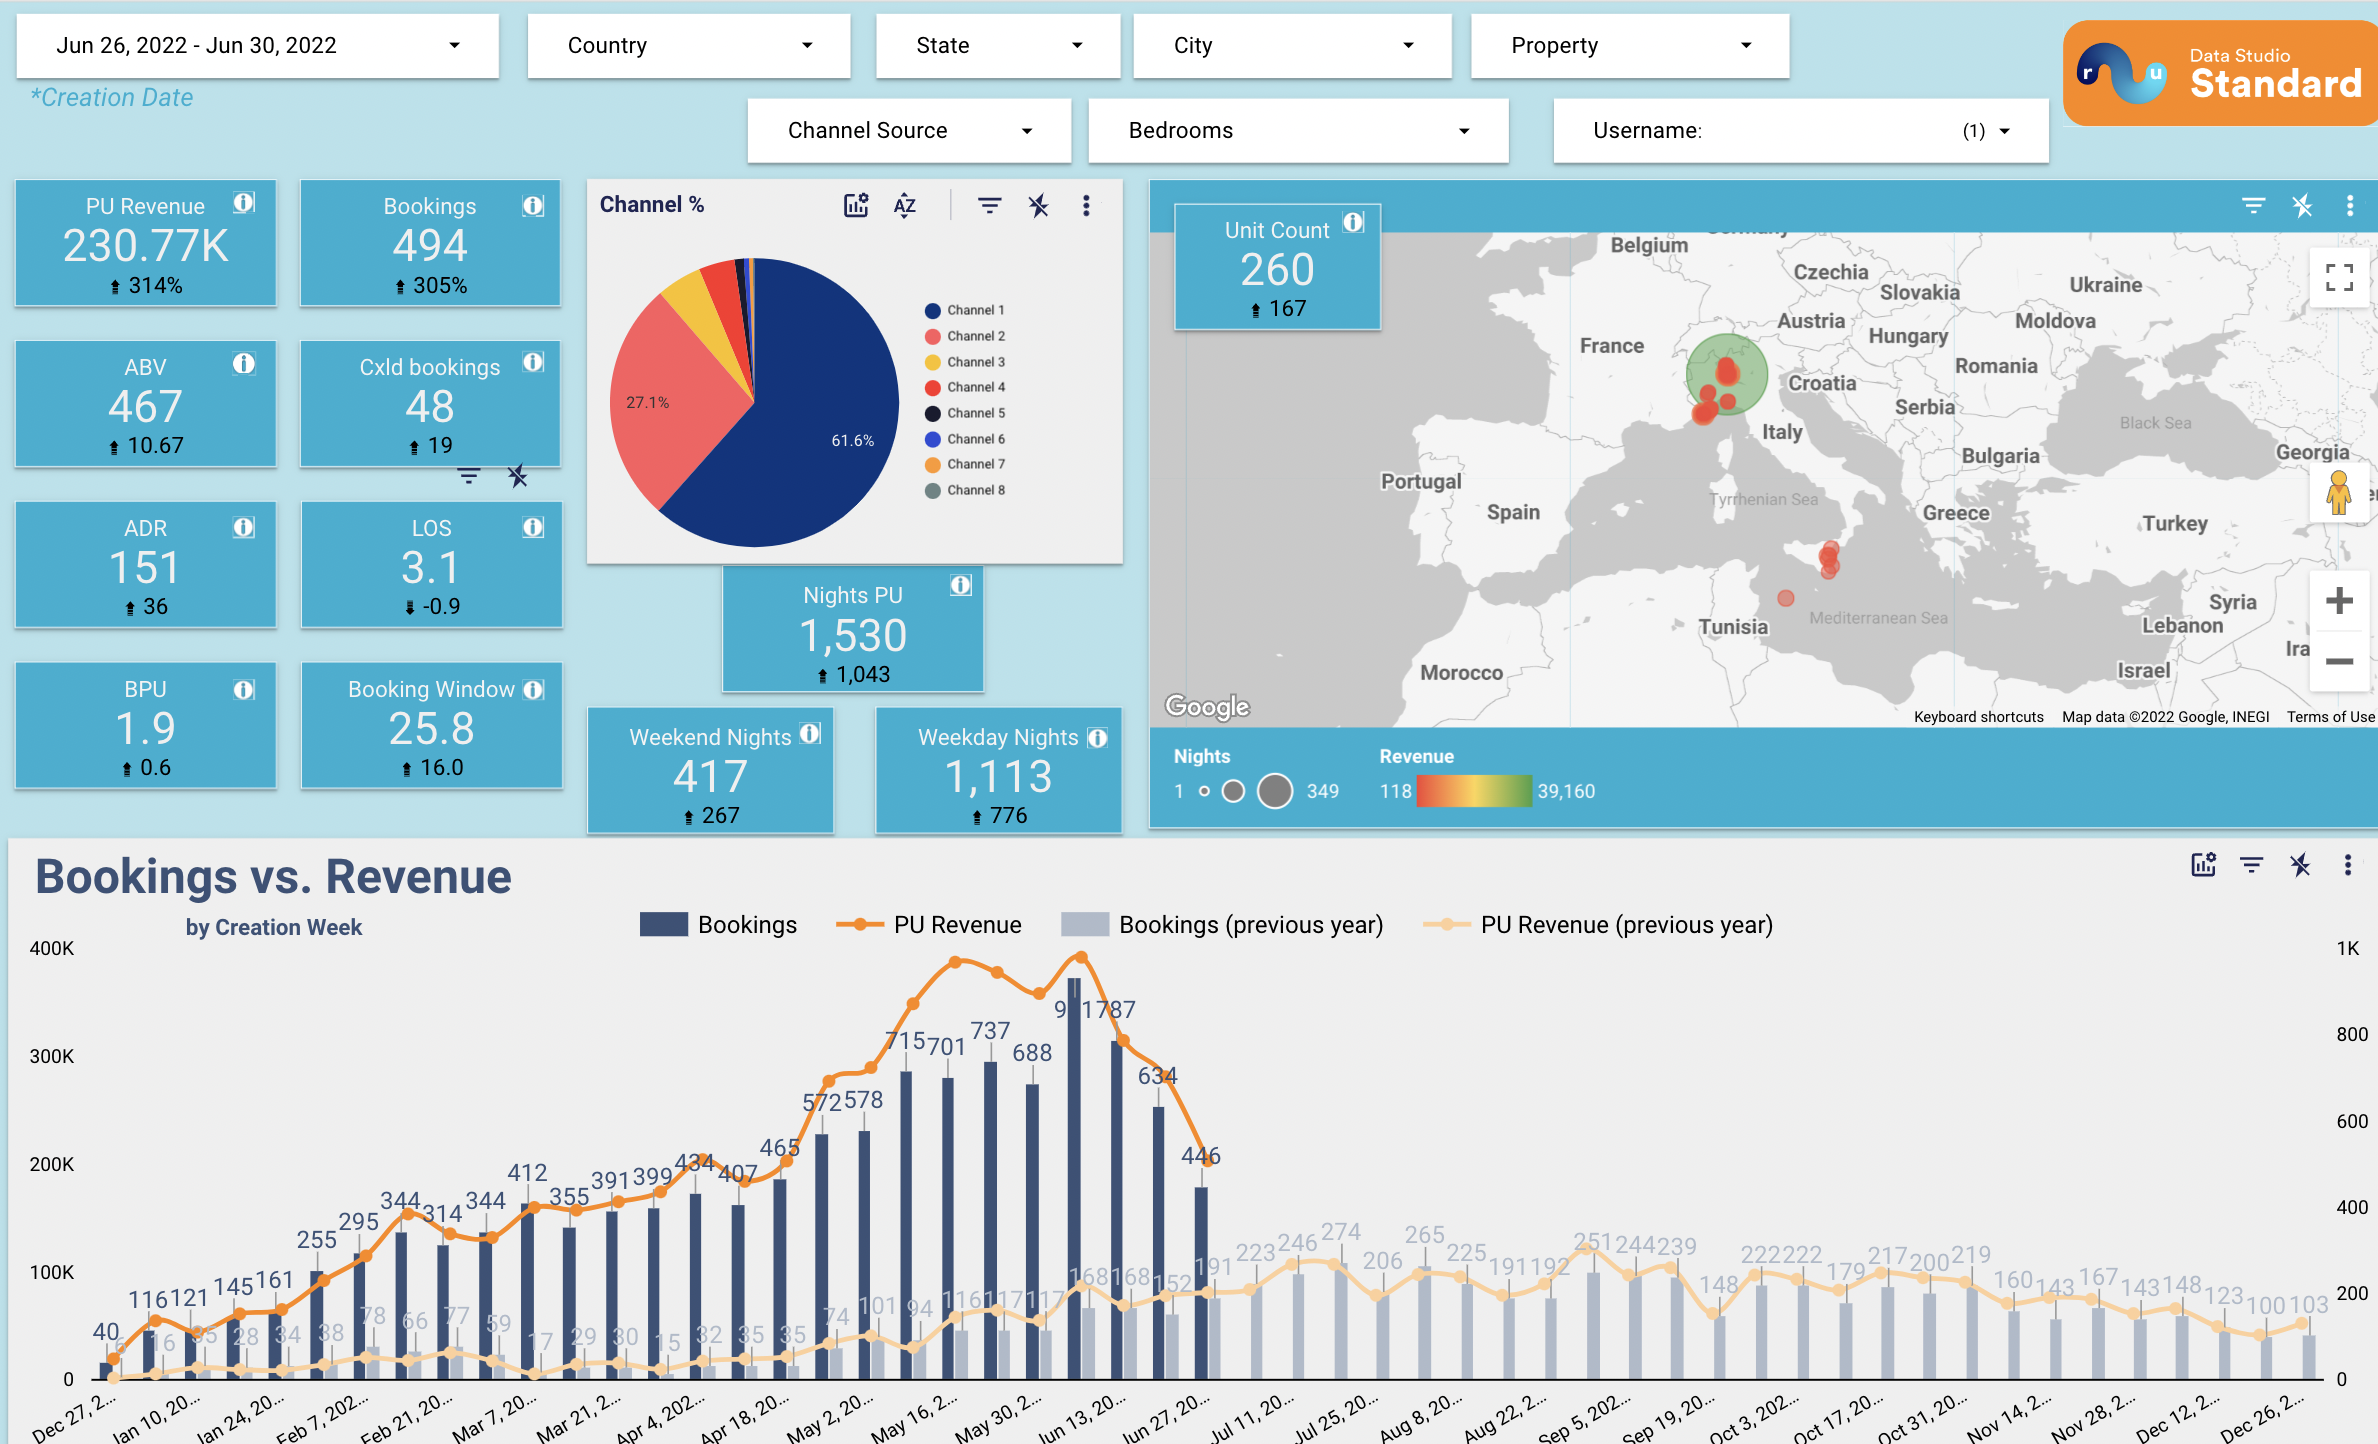
Tracking which channels your pickup is coming from in a certain time period lets you compare your channels to each other, see which ones are over or underperforming, and take action before your booking window closes.
For example, if you notice that a specific channel is outperforming the others, you may want to double down on it.
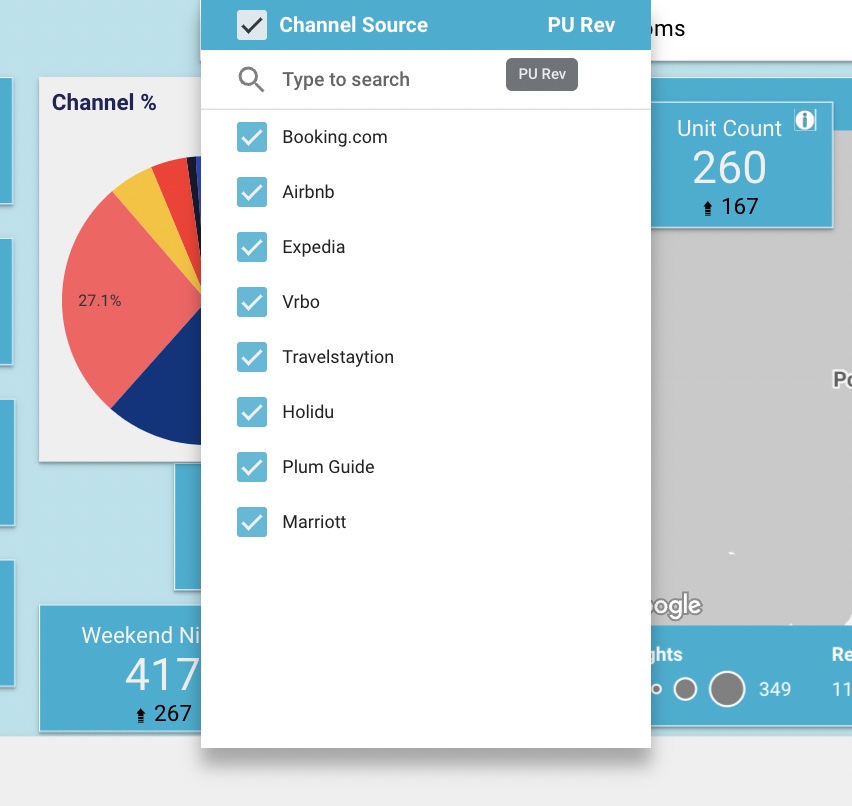
Let’s take Booking.com as an example. If you want to push Booking.com, you can:
- Create exclusive promotions that allow you to increase your visibility on Booking.com. Using the Booking.com Promotions tab in Rentals United, you can apply mobile rates, LOS discounts, last-minute offers, country rates, etc.
- Use the RU Data Studio Property Health Cards to check the quality of your listing content, spot opportunities for improvement and optimise your listings for conversion.
You can take similar actions if you notice that a channel is falling behind compared to the others, but you still want to push it for other reasons (it has lower commissions, is easier for you to work with operationally, has a longer average length of stay, etc).
You can even filter the data down to a specific channel, so you can see how that channel’s performance has evolved over time. For example, you can compare Airbnb’s performance this week to last week.
The filters in RU Data Studio’s Pickup High Level report make it easy to get even more specific insights.
- Filter by city. For example, if you’re having trouble converting your properties in Milan, check your channel mix for that city and find opportunities to improve your conversion rate.
- Filter by bedroom count. For example, if your villas are pacing high but your one-bedrooms aren’t, focus on your smaller units and make adjustments.
- Filter by property. Drill down to a specific property to see its performance on channels over time.
The Pickup High Level report is included in the RU Data Studio Basic package, which means it’s accessible to all Rentals United customers free of charge.
If you want to break it down further and look at stayed-on dates too, you can use the Stay Date Breakdown report (accessible by upgrading to the RU Data Studio Standard package).
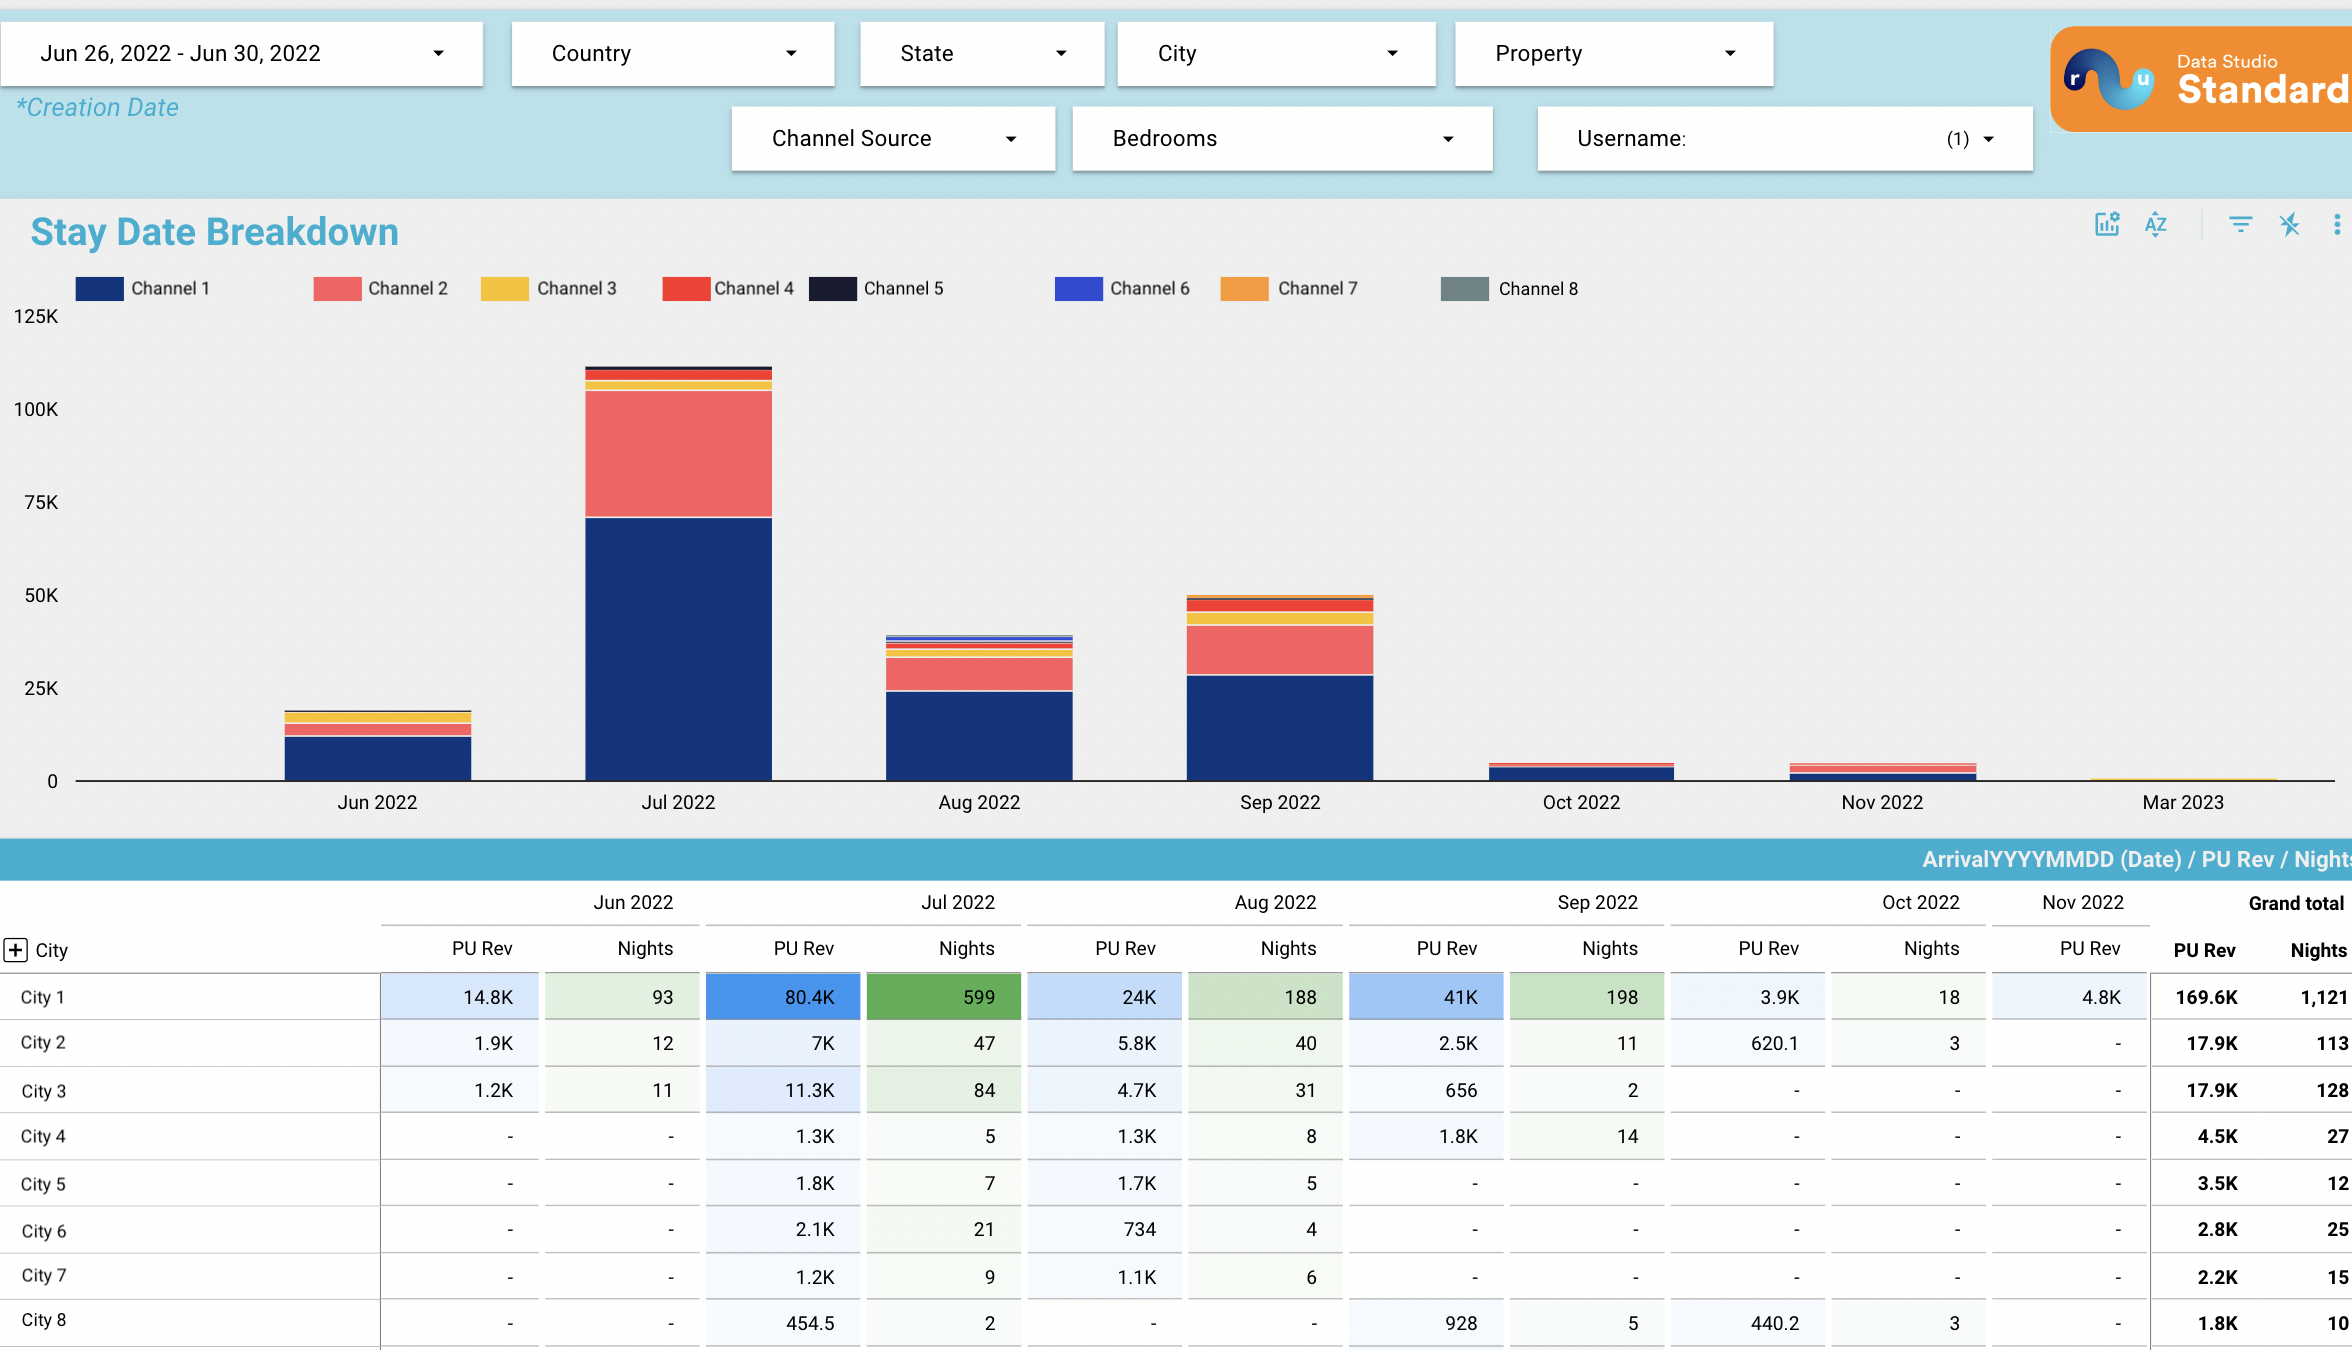
Using this report, you can identify when the revenue you picked up in a certain date range is actualising, as well as your channel mix (see the coloured bars).
This allows you to spot even more opportunities. For example, if one channel is producing a lot of bookings further out, you may want to boost your conversions on that channel by applying an early-bird discount. This is a great way to ensure a solid base for lower-season bookings.
Conclusion: Start tracking your pickup now
Extracting pickup data from a standard reservation list is not easy, but it can be done using an Excel sheet and conditional formatting. You’ll just need to convert check-in and check-out dates into a format that allows you to break the reservation up into individual days.
Fortunately, tools like Wheelhouse and Rentals United Data Studio have already done a lot of the work for you. They allow you to create visual pickup reports that make it easy to spot trends and opportunities at a glance.
If you’d like to learn more about using pickup in your daily revenue management practice, contact us. We’ll walk you through Rentals United Data Studio and show you how to spot opportunities to improve your channel mix. You can also contact John DeRoulet to learn more about Wheelhouse and how to use a pickup report.
Another tool worth checking out is Key Data, which also shows historical pacing so you can compare your numbers year on year.
Whatever tools you use, pickup allows you to track how your sales are pacing and take actionable revenue management decisions that will get you closer to hitting your revenue goals.